
RRadio blackout
—
Waiting for NOAA data
Driven mainly by solar X-ray flares; effects are strongest on the sunlit side of Earth.
NOAA SPACE WEATHER MONITOR
Follow current NOAA space weather scales, solar wind conditions, geomagnetic activity and the aurora outlook. Live readings are provided by the NOAA Space Weather Prediction Center (SWPC).
CURRENT CONDITIONS
The latest observed level for radio blackouts, solar radiation storms and geomagnetic storms. A zero level means NOAA currently reports no event at that scale.
—
Waiting for NOAA data
Driven mainly by solar X-ray flares; effects are strongest on the sunlit side of Earth.
—
Waiting for NOAA data
Tracks energetic solar particles and possible effects on spacecraft and polar communications.
—
Waiting for NOAA data
Measures geomagnetic storm strength; stronger storms can expand the atmosphere and increase drag on low-orbit satellites.
Forecast levels for today and the next two UTC dates, when reported by NOAA.
Loading scale outlook…
UPSTREAM SOLAR WIND
Spacecraft near the Sun–Earth L1 point sample the solar wind before it reaches Earth. These measurements help describe incoming solar-wind conditions.
Bz is the north–south component of the interplanetary magnetic field in geocentric solar magnetospheric coordinates. A sustained southward (negative) Bz can couple more effectively with Earth’s magnetic field, but no single reading predicts aurora or a storm by itself.
GEOMAGNETIC ACTIVITY
Kp summarizes disturbances in Earth’s magnetic field. The chart combines NOAA’s recent estimates with its three-day forecast; forecast points are labelled separately from observed values.
NOAA’s G1 minor geomagnetic storm threshold begins at Kp 5. Kp is a global index and does not determine the exact aurora visibility at a particular location.
SHORT-TERM OUTLOOK
NOAA’s OVATION model estimates aurora location and intensity about 30–90 minutes ahead. The maps cover both polar regions.
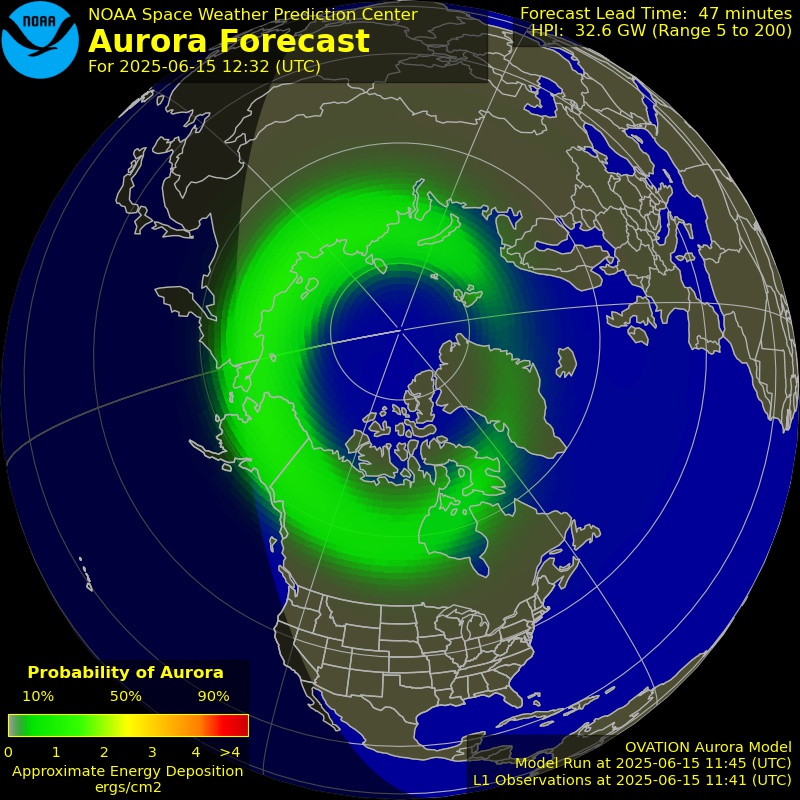
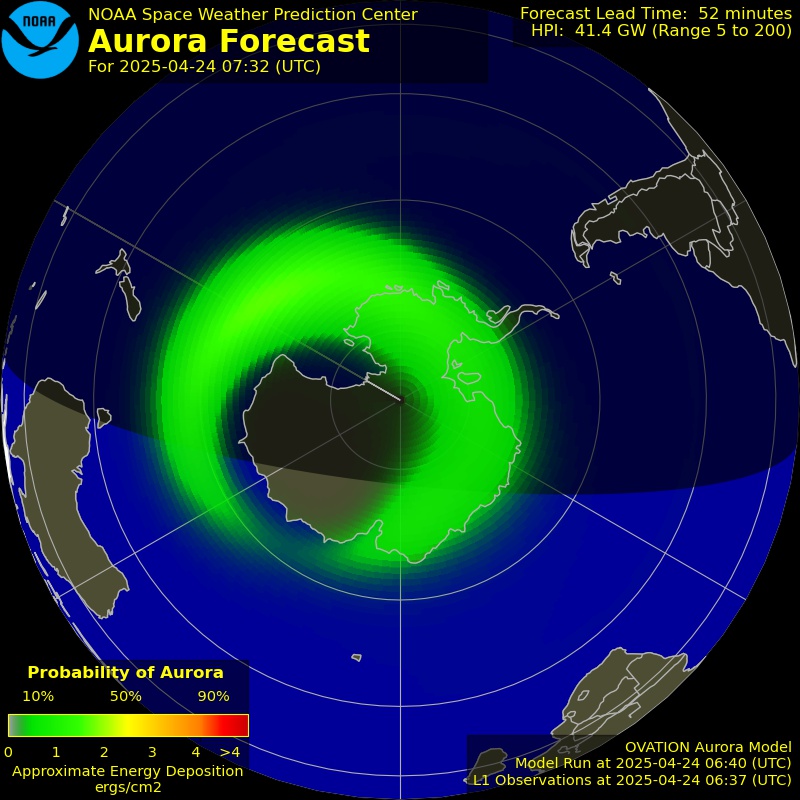
An aurora forecast map is not a promise that aurora will be visible from your location. Local darkness, clouds, Moonlight, light pollution, the horizon and viewing direction all matter.
OFFICIAL BULLETINS
Recent notices are shown with their issue time. A recent bulletin may have expired or been superseded; use its stated validity period and NOAA’s current scales before treating it as active.
Loading NOAA notices…
Complete horizon crossings only. Maximum elevation is sampled every 30 seconds. Sunlight, darkness, weather and terrain are not checked; this is not a visible-pass forecast. A continuously visible satellite may have no horizon crossing in this window.
Save a shortlist of the catalog rows currently visible above. Select a spacecraft to unlock its orbit snapshot and pass-planning tools.
Use the live tool above to explore Space Weather and Aurora. This guide explains what the page measures, how to use the new exports and planning controls, and which checks belong to the mission or data provider. Follow the official source for Space Weather and Aurora for the latest mission or product context. Keep calculated positions, photographs and operational announcements distinct when interpreting a result.
Space weather describes disturbances in the space environment that can affect Earth and spacecraft. A solar flare, energetic-particle event and geomagnetic storm are different processes, so the dashboard presents more than one NOAA product. A current observation is not the same as a forecast for tomorrow. Read each section’s timestamp before combining values, because products may be issued or measured at different times. The dashboard figures show the current interface at their stated capture times; their saved values are not a continuously updating NOAA feed. Follow NOAA SWPC for the authoritative product descriptions and latest notices.
NOAA’s R scale describes radio-blackout impacts associated with solar flares, the S scale describes solar radiation storms and the G scale describes geomagnetic storms. Their numbers do not represent interchangeable measurements. Solar-wind speed, the total magnetic field Bt and its north–south component Bz add upstream context, while Kp summarises broad geomagnetic activity. A sustained southward field can matter, but one Bz number alone is not a guaranteed aurora forecast for a city. The guide keeps observations, impact scales and model outlooks separate so a dramatic value in one panel is not misread as proof of every possible effect.

An auroral forecast oval describes a model outlook, not a promise that everyone within a coloured region will see the same display. Geomagnetic latitude, darkness, cloud cover and light pollution affect the practical view. A camera may record colours or faint structures differently from the unaided eye. The aurora-map screenshot illustrates a saved NOAA model outlook and is not a guarantee of tonight’s ground-level scene. Use a suitable local weather forecast and a dark observing site alongside NOAA’s information. The dashboard export records the currently displayed values and timestamps rather than turning them into a personal visibility guarantee.
Before interpreting a result, confirm which page and object you have opened. Names can be similar, and a directory is a collection rather than a single live target. The current tool above remains the main source of the displayed result. Use the linked official mission or operator resource for scientific purpose, spacecraft design and operational announcements. Public catalog information and a live-looking animation do not establish that every payload is operating normally. Keep an object’s identifier with your notes when one is available. For broader exploration, the satellite directory and calculation guide explain how the site organises its data.
A changing display can be calculated from an earlier observation or issued product. The orbital epoch describes the reference time of an element set, while a server-cache update describes when the website retrieved data. These are different timestamps. An issued forecast has another meaning again. Read the relevant time and convention instead of equating animation speed with data freshness. The added tools do not invent a missing value when the source is unavailable. A saved snapshot is a record of one displayed or calculated state, not a feed that updates itself after downloading. Revisit the page for a new result.
Local directions and horizon-crossing times depend on the observing coordinates. Use the website’s existing shared location control when you need those calculations. This upgrade reads saved coordinates and does not create a separate location box for each tracker. Verify the site before comparing a prediction with what you see, especially when you travel. A geographic satellite marker over one region is not automatically a visible object above another region. For the observing sky around you, combine the relevant tracker with Night Sky Tonight and your own horizon checks. Mountains, trees and buildings are not included in a simple geometric horizon.
A useful observing session combines the appropriate event with darkness, weather and a clear viewing direction. Moonlight can make faint objects harder to recognise, while a bright spacecraft may remain conspicuous. Check the Moon Calendar for phase context and the Astronomy Calendar for other events near the session. Avoid turning a modelled opportunity into a promise of visual success. Keep notes when clouds interrupt the view or the target is too faint. An honest record of an unsuccessful session can be useful when comparing sites and conditions later.

The Earth-map background supplies geographic context. It is not transmitted by the selected satellite and is not a live global weather camera. The marker and orbit overlay have a different source and timestamp from the background imagery. Satellite-map tiles can be assembled from observations taken at different times, so a familiar-looking landscape does not establish current cloud or lighting conditions. The 3D globe is another way of presenting geometry, not another spacecraft telemetry feed. Use map controls to orient yourself, then read the data panels for the result you actually need. Credits identify the relevant imagery provider.
The additional export tools preserve the type of result rather than providing an unlabeled number. A directory CSV represents currently displayed catalog rows. A tracker JSON contains the selected public record and a calculated current state. A pass iCalendar file contains filtered geometric horizon crossings with UTC timestamps. The space-weather JSON captures displayed products and their accompanying labels. Choose the appropriate export for your task, and retain its caveats when sharing it. Changing the page after downloading does not update the saved file. Recalculate or export again when the source, observing site or planning window changes.
The images in this guide are fresh screenshots of the running SpaceTracker.live interface, captured during this update. Each caption identifies the page, example object where relevant and capture time. Map imagery is credited to Esri, while the orbital overlay follows the site’s public-data calculations; space-weather products are credited to NOAA SWPC. A saved screenshot is an interface reference rather than live telemetry or a photograph of the spacecraft. The figures appear between explanatory sections so you can connect a control or data field with the task it supports. Keep their timestamps and source context when sharing them.
Write down the page, selected object when relevant, observing site, time zone, data epoch and the practical conditions. For a satellite session, include the direction and approximate interval you followed; for space weather, record the product timestamps and the actual sky conditions. This makes later comparison more meaningful than saving only a screenshot of a colourful display. The pass-prediction tool and Satellites Above Me support further local exploration. Use official source links to verify an important claim and treat the tracker as an educational planning aid rather than an operational control system.
Product reference: NOAA Space Weather Scales. The live dashboard continues to use NOAA’s existing observations and forecasts with their original product timestamps.
The scales, solar-wind summaries, magnetic-field readings and forecast products can have different update rhythms. Their timestamps are therefore part of the information rather than decorative footnotes. A dashboard refresh can retrieve several products together without making them simultaneous measurements. Read the time on the speed and magnetic-field cards before comparing them. For definitions and issued information, use NOAA SWPC’s source products. The displayed-dashboard JSON preserves the labels and values available at export. It is not a continuous time series or a guarantee that every source was refreshed at the same instant.

Bt describes total field strength, while Bz describes its north–south component in the stated coordinate convention. Sustained southward conditions can favour coupling with Earth’s magnetic environment, but duration, strength and other conditions matter. A momentary reading is not sufficient to promise an aurora at a particular town. The dashboard keeps these observations separate from the forecast oval and planetary activity products. Read NOAA’s impact-scale explanation when translating activity into possible effects. Avoid converting an attractive screenshot or a negative Bz value into a precise local visibility percentage that the source product does not provide.
Kp summarises broad geomagnetic activity, while a local aurora observation depends on geomagnetic location, timing, darkness, cloud cover and light pollution. A camera can also record a faint display differently from the unaided eye. Combine the product outlook with local observing conditions and Moon illumination rather than relying on one global number. The forecast oval is a modelled outlook, not a promise that every shaded point has a clear and colourful view. Record what actually happened at your site alongside the product timestamps if you want a meaningful comparison later.
Geomagnetic disturbances can change the upper atmosphere and affect drag on low Earth orbit spacecraft. They can also be relevant to spacecraft charging, electronics and radio propagation. This dashboard provides environmental context but does not calculate a new trajectory or predict failure for each satellite. Continue to use the selected spacecraft’s public elements on the ISS tracker or weather-satellite tracker. Updated orbital records may improve a later geometric prediction. Do not apply an invented manual correction to pass times simply because the space-weather panel shows a higher activity level.
The new figures come from the current Space Weather page and show its scale cards, upstream solar-wind section and aurora outlook. They replace older solar or orbital photographs as the main interface explanation. A screenshot’s readings and forecast image belong to its capture time, and the figure is not a current forecast after that time. The live dashboard above remains the place to check the newest available products. Captions identify SpaceTracker.live as the interface and NOAA SWPC as the product source. This separation makes the guide concrete without implying that a saved dashboard picture can independently predict tonight’s sky.
The updated screenshots are reference views of the running page, captured during this article revision. They are placed beside the explanations of the corresponding controls and panels. Read the caption’s page, example object and capture time when comparing a figure with your own result. The figure remains static, while the real tool above can load a different record or a newer value. Differences are therefore expected and are not automatically errors. Use the live controls for a new calculation, and use the article figures to recognise the workflow. When sharing a screenshot, keep its context attached rather than cropping away the identifier or timestamp that explains it.
The contextual links throughout this guide connect a particular idea with the relevant tool or official source. A link on pass prediction leads to local geometry, a Moon link adds phase context and an operator link supplies mission or network information. These destinations have different roles; none should be treated as a substitute for every other source. Follow the link that answers your next question, and preserve the time convention and object identity as you move between pages. If a current data source is unavailable, return later or use its official product page instead of inventing a value from an old illustration.