
How to Read a Space Weather Dashboard and Plan Aurora Viewing
Understand space weather observations, forecasts, Kp and aurora planning. Read product times and combine solar information with darkness and local conditions.
Space weather is not a forecast of clouds over your town. It concerns conditions in the space environment, including solar activity and disturbances that can affect Earth's magnetic environment. A useful dashboard separates observations, forecasts and alerts instead of treating them as one number. Start with Space Weather and read the labels and timestamps before drawing a conclusion.
For official product descriptions and current notices, use NOAA's Space Weather Prediction Center. The site dashboard provides an accessible way to explore those products, but a public summary should not be read as personal confirmation of an aurora sighting or as a diagnosis of a device problem.
Read each product's time separately Different measurements can be acquired or issued at different times. A solar image, a geomagnetic index and a forecast may therefore show different timestamps. They are not necessarily contradictory; they describe different products. Check both the product type and time before combining them into a story about what is happening now.
A saved screenshot is useful for explaining the interface, but its values are a historical example. Return to the live product when you need current conditions. A page-refresh time is also not automatically the acquisition time of every measurement. This simple distinction prevents an old but attractive image from being mistaken for the newest observation.
Solar flares and coronal mass ejections differ A solar flare involves a release of electromagnetic radiation. A coronal mass ejection involves material and magnetic field expelled from the Sun. They can be associated, but they are not interchangeable events. Their possible effects at Earth depend on different physical circumstances and timing. Do not assume that a flare label alone predicts an Earth-directed arrival.
Read the relevant official product rather than mixing every solar feature into one generic 'storm'. NOAA's space-weather phenomena explanations give the definitions behind the dashboard. The goal is not to memorise every category before using the page. It is to know which question each section can answer and which conclusions need additional information.
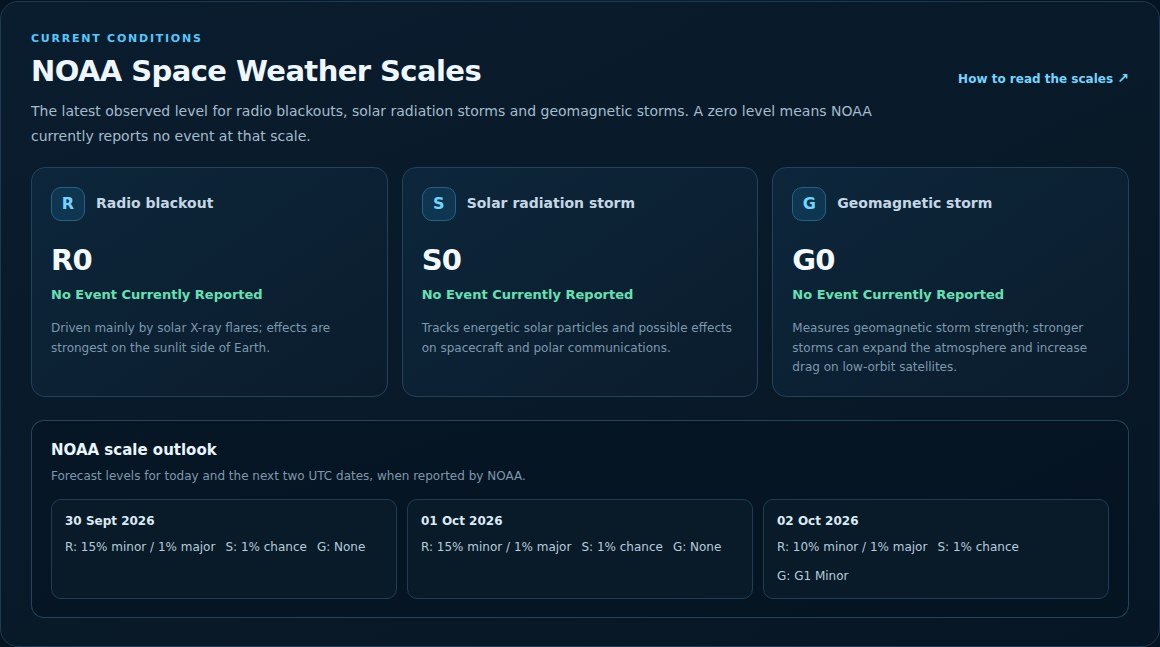
Kp summarises geomagnetic activity The planetary K index is a broad indicator of geomagnetic activity. It is useful context for an aurora plan, but it is not a brightness reading for your backyard. The relationship between an index and local visibility is approximate and depends on geography, darkness and the actual development of the event.
Read NOAA's aurora-viewing advice before turning a high number into a promise. A clear, dark view and suitable location matter. An observer under a favourable part of the auroral oval may have a different experience from another observer at a similar ordinary latitude. Use the index as one clue rather than a universal threshold for guaranteed colour in the sky.
A forecast describes an expectation An observed index reports a measurement for its defined period. A forecast estimates what may happen later. A watch, warning or alert has its own meaning in the provider's system. These labels should remain visible when summarising the information. Removing them can turn a possibility into a claim that an event has already occurred.
If you compare two products, make sure their validity periods overlap. A current quiet observation and a later disturbed forecast can both be reasonable. The useful question is when each applies. Recheck near your observing session because conditions and forecasts can evolve. The dashboard is a planning aid, not a fixed appointment with an aurora.
Solar-wind values need context Solar-wind speed and magnetic-field measurements contribute to understanding how the space environment develops. A single large value is not enough to predict every consequence at Earth. Direction, duration and the location of the measurement also matter. The provider's description explains what a product measures and how it relates to forecasts.
Avoid reading a live plot as if every point were a direct measurement at your observing site. Some products come from spacecraft upstream of Earth or from a global network. Their meaning depends on those locations and processing conventions. NOAA's solar-wind description is a useful source when the graph raises a question that a short label cannot answer.
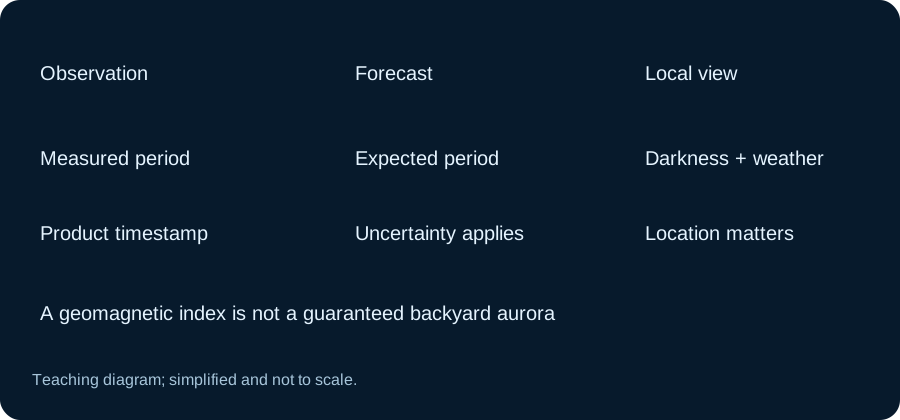
The product type and validity period determine which question a measurement or forecast can answer. Read NOAA’s space-weather product information when you want to check the underlying context rather than infer it from a thumbnail or summary number. Compare it with the live dashboard for the selected question.
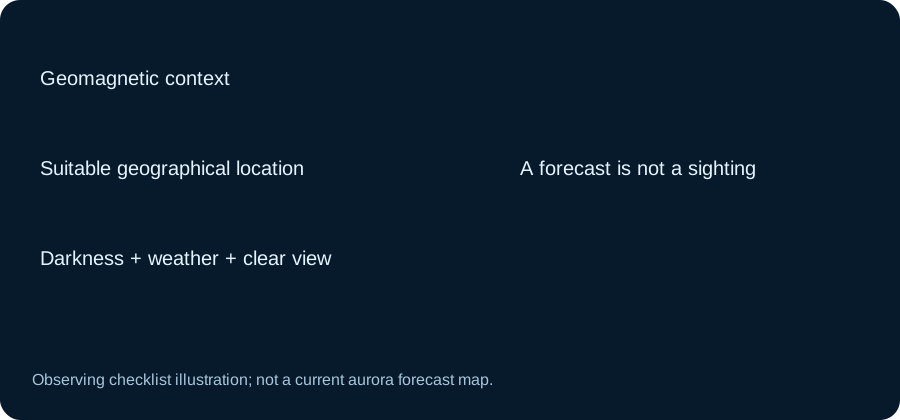
Plan an aurora session like a sky session Start with a suitable geographical opportunity, then check darkness, weather and the Moon. A space-weather forecast cannot remove cloud or local light pollution. Use Twilight Times and Moonrise and Moonset to understand the background for the chosen period.
Find a safe, accessible observing place with a clear view in the relevant direction. Do not make an expensive journey based on one summary value alone. If you are already in a promising region, leave time for the display to change and keep expectations flexible. The night-sky planning guide provides the same local checks that help with other faint sky targets.
A camera view can differ from your eyes A camera can accumulate light differently from unaided vision, so a colourful photograph does not always describe the appearance to someone standing there. Exposure, processing and white balance can strengthen colour. When sharing a record, state the observing context and avoid presenting an enhanced image as a guarantee of what every viewer would see.
If you notice a faint glow, compare its shape, direction and movement with the forecast and surrounding conditions. Light pollution, cloud and other sky phenomena can be confusing. A photograph alone is not always enough for confident identification. Keep the time, location and viewing direction so the observation can be checked later.
Do not diagnose satellite or navigation faults from one chart Space weather can affect technologies, but a problem on a phone or tracker can have many ordinary explanations. A slow page, a poor network connection or a reflected navigation signal near buildings is not proof of a geomagnetic cause. The GPS geometry guide explains one set of everyday positioning factors.
For an actual service issue, use the operator's notices and appropriate diagnostics. The dashboard offers environmental context, not a personal fault diagnosis. This keeps an interesting science topic from becoming an explanation for every technical inconvenience that happens on the same day.
Compare a prediction with an observation afterward If you plan an aurora session, save which forecast and validity period you used, then record the weather, direction and what you actually saw. A blank sky under cloud is not a clean test of the space-weather prediction. Likewise, a faint camera-only glow and a bright naked-eye display are different observations and should be described separately.
This makes the follow-up useful even when the session is disappointing. You can ask whether the location was favourable, whether darkness was sufficient and whether the forecast changed. Avoid judging an entire forecasting system from one poorly documented outing. A short, honest record helps you learn which products are useful for your circumstances and leaves the scientific uncertainty visible instead of replacing it with a guaranteed-sighting claim.
Make the dashboard answer a specific question Choose whether you want to learn about a solar event, follow geomagnetic activity or plan an observing session. Read the relevant product, its time and its uncertainty. Compare with the official source if an important detail is unclear. There is no need to interpret every graph at once.
Finish by recording the product and period you used, then return to the live space-weather page for updates. Keeping observation, prediction and local visibility separate makes the information more useful. It also leaves room for the real fascination of the subject: changing solar conditions interacting with Earth's environment through processes more complex than a single dashboard score.
Keep the source and observation period in your notes
A short record might contain the product name, its stated period, your local weather and whether a glow was seen with eyes or only in a camera exposure. That is enough to make a later discussion clearer. A dashboard screenshot with no time or place cannot explain the observing outcome by itself. Preserve uncertainty when the evidence is incomplete and return to the official product for definitions.
Continue with the live dashboard for the selected question, and keep NOAA’s space-weather product information beside the result when you need its definitions or broader context.